Last Updated: February 10, 2021
By Andrew Duguay, Chief Economist at Prevedere
As of late, Americans are constantly being bombarded with news and expectations on whether the stock markets are at a new low or if COVID-19 virus cases have reached a peak. Beyond the daily numbers, many business leaders question how the pandemic will impact the economy long term. Economists have been trying to illustrate potential economic recovery scenarios by using letters. Most commonly, they refer to a V-shaped recovery versus a U-shaped recovery. Others ponder a W-shaped recovery, which indicates a dip followed by recovery, followed by another dip. This could be related to a potential second wave of the virus, prompting another round of shutdowns. There is also talk of a sideways J to an L-shape recovery. This alphabet soup makes it really hard to plan.
Forecasting Baseline Scenarios
To tackle this, our economist team has built what is the most likely baseline scenario. With all this uncertainty, our forecasting and planning needs must factor in an optimistic side and a pessimistic side. With this in mind, we want to share some of our baseline assumptions for the US macroeconomic environment moving forward to help you with your second half of the year planning as we start thinking about the road ahead.
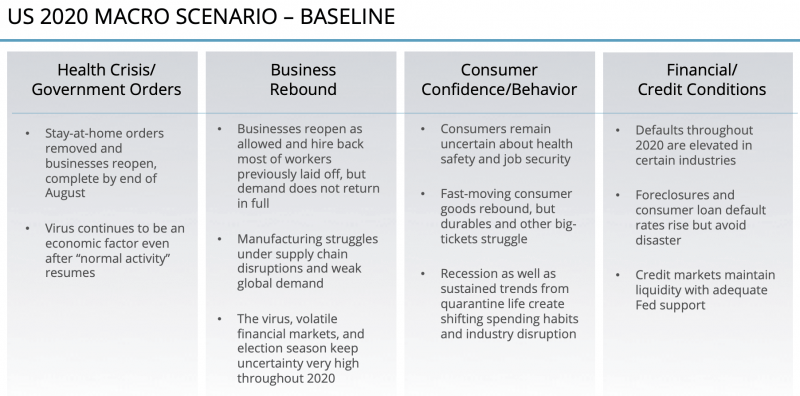
Moving forward, of course, requires the virus to be contained. As economists, we step back and acknowledge that this is a health crisis. We are not the experts on when business restrictions should be lifted, when social distancing can be relaxed, or when a business can get back to normal. There are obviously extensive health ramifications along with economic ramifications for any of these decisions. We’ll leave those decisions to the health experts. However, we’ve incorporated all that we’re reading into what we feel is a reasonable expectation for the health crisis to subside.
It’s remarkable that we’ve seen what appears to be a peak over the past week with the number of new cases each day coming in slightly lower than the day prior. However, as we’ve seen in Asia and in Europe, that peak in virus cases isn’t necessarily the end. It’s more the start of a new phase. We need that number to come down swiftly. We need to continue to test, care for those who have the virus, and perform contact tracing of new infections so that we contain outbreaks.
It seems that the social distancing needs to extend much longer after we reach a peak in new cases, which means we’re really just at the forefront of it. It’s overall a positive sign that we’re headed in the right direction, but from an economic standpoint, we realized that it’s not going to be a quick back-to-business.
When we talk about business rebound, we are planning on the fact that businesses will reopen and hire back a good chunk of the workforce that has been previously laid off. But by no means are demand and jobs going to return to pre-COVID levels, according to surveys like the one from the National Association of Business Economists.
Even under the median projections of recovery, we’re still looking at an unemployment rate close to 10% by the end of the year, followed by unemployment of around 6.5% in 2021. This prediction shows us that a lot of jobs that were lost today are going to disappear permanently. They’re not coming back.
By comparison, before this crisis, the unemployment rate was well below 4%. We’ve learned from previous economic crises that some jobs don’t return. Displaced workers are going to have to retrain, reskill, and apply for new work. All that is a net negative on the total economy.
What it comes down to is that business will likely not return to “normal” after this crisis. Fortunately, we do expect jobless claims and related economic hardship to drop drastically after the health crisis, and we hope that the stimulus in its many forms will help soften the temporary blow. However, we do expect that on the backside of this, the recovery is going to be gradual. We’re going to see a lot of bumps in the road, particularly with any sort of global supply chain factors because this is truly a global recession.
We’re seeing emerging markets in Europe, and obviously Asia, going through this economic downturn that has many facets to it, including consumer behavior. We’re just now starting to get some of the first signals of US consumer sentiment data during this crisis.
Many of the March surveys that were fielded in the United States were still too early to make a prediction. Consumers were in denial about what this crisis meant; whether they would lose their jobs or whether this just meant some temporary inconvenience of working from home. But over time, the reality set in with crisis expanding to all 50 states, creating a situation where everybody is impacted.
Now we’re getting the first few measures of what consumer confidence and behavior looks like in the middle of the crisis. Some of these will be very telling clues as new data comes out about what the second half of the year looks like. And then, of course, we have the financial markets which have settled down lately with the rather large backstops from the federal government and the monetary policy as backups. Not only through buying the traditional bonds during the crisis, but also by going to the corporate debt markets and providing some liquidity there, as we predicted would happen. It looks like the Fed has zeroed in on trying to mitigate business corporate debt risk, which we know is elevated.
This brings us around to our baseline scenario, which says there’s going to be default and some foreclosures. However, the Federal Reserve is going to continue to provide adequate support so that the credit markets will maintain liquidity throughout this crisis. While that doesn’t mean that businesses won’t struggle or need to draw on their credit lines or increase debt in order to manage this crisis, it does mean that this won’t turn into a full-blown financial crisis. A lot of those risk spreads that were elevated at the very start of this crisis have now come down because there’s more liquidity in the market. We’re also expecting fewer bankruptcies than predicted just two or three weeks ago due to some of the Federal Reserve actions.
This baseline scenario paints a picture showing economic pain, but nothing like a great depression. And the recovery, while it’s going to be bumpy and slow, will still be a recovery. Depending on the lens you view this crisis through, compared to a few weeks ago, this could be optimistic news or this could be pessimistic news. But we think that in the wide spectrum of scenarios from a V-shape recovery to an L, a V-shape meaning a quick recovery and an L-shape meaning no recovery, our baseline scenario is really somewhere in between.
We see recovery in the second half of the year. But it’s going to be mild. It won’t be until 2021 that things really get back on track. And even then, the future is going to hold higher rates of unemployment than the past few years, and there’s going to be some lingering effects to this.
In the third column, we have outlined Consumer Behavior. This is the latest data that we’re getting out of multiple sources about what consumers are thinking and saying about their future spending habits.
The following chart shows a survey of consumers, asking about their spending plans for the next six months. Do you plan on spending more or less and in which categories? This data allows us to measure consumer sentiment compared to last year. This index gives us a view of the swings in sentiment over the course of time. What we’re comparing here is this month versus the same month last year. And what we’re seeing is how consumers have changed their outlook on how much they’re planning to spend.
What Is The Consumer Feeling?
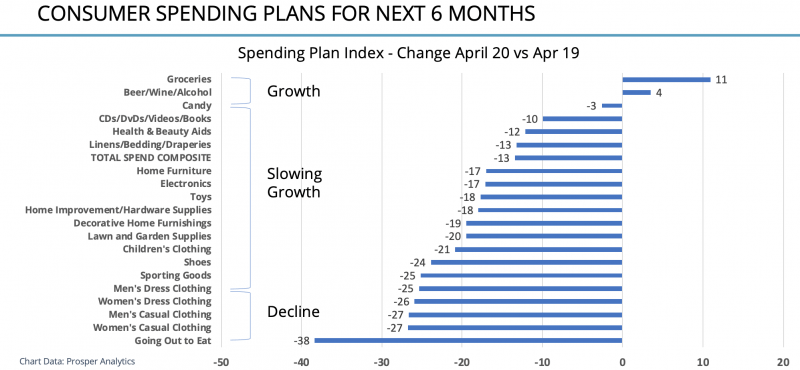
Looking at the graph above, we see a couple of winners here. Those in businesses that have been deemed essential business. Grocery is a big winner as everyone is home and shopping at the grocery stores because of limited food options such as dining out.
Another is the beer, wine, and alcohol categories. Consumers intend to spend more on beer, wine, and alcohol, not just in the near term, but over the next six months, more than in similar surveys one year ago. There are multiple different categories of consumer spending that consumers say they’re going to spend more on.
Regardless, the survey also suggests that consumers are more hesitant about spending. In response, we’re calling for slower growth, from a consumer intent standpoint. Consumers are thinking about spending in these categories, but they are a lot less optimistic than they were 12 months ago about the amount they’re going to spend in these categories.
In descending fashion, the biggest decline in discretionary spending is on goods towards the bottom of that list, from sporting goods to shoes, to children’s clothing. People are intending to spend more at least online, but in reality, more of them are saying they’re going to spend less.
As we look further, items such as candy, and then the videos, and entertainment-related small ticket items are seeing less of a hit. And then there are certain categories where consumers are saying not only are we spending less now but over the next six months, we’re going to decrease our spending in those areas.
An obvious category is going out to eat, which has limitations in the near term. Clothing is another. With consumers not having to dress up and go out and go to work every day, consumers are basically indicating that they are going to cut back on our apparel budgets.
What The Past Tells Us
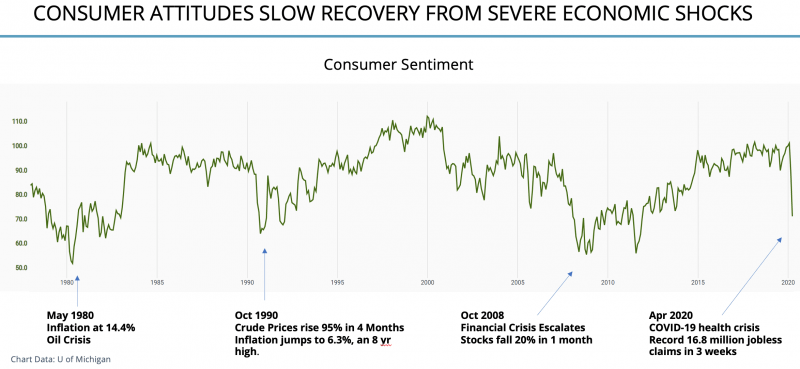
Overall, consumers are feeling less optimistic. How does this compare against previous crises? For this, we reference the University of Michigan’s Consumer Sentiment survey. We have data from this all the way back into the 1970s, which provides a good way of looking at the context of the current crisis versus previous crises. Now, as an economist, it’s common to show what consumer sentiment does in recessions. But instead, for this chart, I wanted to show previous points in time where there was an elevated event, some crisis that really jarred consumers.
I picked three use cases to compare April 2020 against. As you can see on the chart these are points where consumer sentiment dropped precipitously. These use cases can be used to learn where consumer sentiment goes from there, how consumers might behave differently.
For the first case, we look all the way back to May 1980. In many ways, the recipe for consumer sentiment disaster is quite the opposite. Right now, we’ve seen about a 60% to 80% drop in oil prices with this health crisis; back in May 1980, it was the opposite. There was the 1979 oil crisis which led to massive inflation in 1980. In May 1980, inflation was at a 14.4% year-over-year. This was devastating for consumers, and consumer sentiment took a big hit from this. One positive aspect of this most recent crisis is that this is not a crisis of consumer costs.
If anything, we think there’s going to be some deflationary aspects to this crisis as the world slows down, and businesses start cutting costs and are more aggressive in their advertising and pricing to consumers. We’ve also seen key commodity prices really shift down, such as the oil glut we’re going through now where oil prices have reduced drastically.
All those things on the Internet are a benefit to consumers. If you think back to 1980 or even October 1990, what we faced then was the opposite—damage and high gas prices that were embedded in the consumer psyche as prohibitive to their normal consumption patterns. In October 1990, we were entering into a wartime scenario, we were starting to go through what we look at historically as a mild recession of the 1990s.
When consumer sentiment really fell and fell drastically, it was in October 1990. Crude prices had been on a tear and climbed to almost double in a four-month period. Of course, that all translated to higher prices at the pump that consumers were not prepared for, and consumer sentiment went down for all key categories.
And this event also had an inflationary impact, with inflation at about an eight-year high in October 1990, a cyclical peak, so consumers were facing many headwinds and many challenges. Comparatively, we have the more recent history of the October 2008 financial crisis where stocks fell 20% in one month and consumer sentiment plummeted.
Similarities that I draw attention to are the fact that you can see consumer sentiment fall off relatively quickly, but what you don’t see is the relatively swift recovery. In 1980, perhaps once oil prices started to subside again, consumer sentiment jumped back up, but it’s still into the 70s range.
When we look at recent history—the past two, three years—we see that consumer sentiment was at a very elevated high, similar to before the October 1990 crash. Relating to consumer sentiment, consumers were generally happy and consistently happy. What you saw afterward is that consumer sentiment went back up but did not reach the pre-recession highs of 1990.
In fact, sentiment oscillated for many years all the way to the mid-1990s before it reached a relatively consistent elevated level. This tells me that consumers don’t just forget the past. They’re very mindful of a crisis. And this is likely to have long-lasting impacts on their sentiment which we know translates into consumer spending habits.
2008 Vs 2020
What we can take away from this is that you can enter a crisis at a much swifter pace. Then, you can exit the crisis when it comes to consumer sentiment. And that will impact consumer spending in multiple ways. If consumers are not as happy, if they’re not as confident, then, we’re likely to see consumers shift their buying and spending habits along the way. And that could last much further out than the health crisis itself. When we want to compare with the numbers out of April to something more recent, a lot of businesses ask what can we use to model the past? It might not make sense to open up the ledgers and look all the way back to 1980 or even 1990 for comparables. But we can compare to a recent crisis situation, October 2008, when the stock market went down by 20% and consumer sentiment fell. Here we mapped different consumer spending intent metrics as measured in April versus what they were back in October 2008.
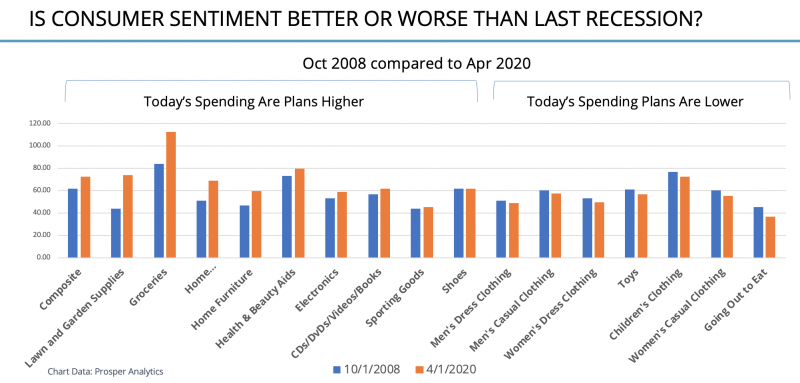
What you can see is that there are some categories of spending where consumers are spending about the same as they were back during the Great Recession of 2008-2009. There’s a lot of areas where today’s spending plans are still higher. For example, when you think about groceries, home improvement, and lawn and garden supplies.
People are out there spending money at hardware stores and thinking about home improvement projects. And they’re still generally thinking about spending more money than they were back during the great recession. And it’s more than just home improvement, there are categories from sporting goods to electronics and even furniture.
Consumer sentiment isn’t quite as low today in those categories as it was in 2008. However, there are areas where consumers are already thinking of cutting back and cutting back more than they were during 2008. And that would be in some areas of clothing, toys, obviously, going out to eat, and a lot in the apparel areas as well.
I’ve outlined some considerations as we try to frame up what today’s crisis looks like compared to past crises. In a lot of the data, you can look long back in history and learn from that. While a lot of people like to talk about how unprecedented and different events today are, we can ground today’s environment in past events and crises to give some context of what recovery can look like.
***
About Andrew Duguay
 Mr. Duguay is a Chief Economist for Prevedere, a predictive analytics company that helps provides business leaders a real-time insight into their company’s future performance. Prior to his role at Prevedere, Mr. Duguay was a Senior Economist at ITR Economics. Andrew’s commentary and expertise have been featured in NPR, Reuters, and other publications. Andrew has an MBA and a degree in Economics. He has received a Certificate in Professional Forecasting from the Institute for Business Forecasting and Certificates in Economic Measurement, Applied Econometrics, and Time-Series Analysis and Forecasting from the National Association for Business Economics.