Last Updated: February 10, 2021
By Andrew Duguay, Chief Economist
Data updated: June 8, 2020
U.S. employment numbers, as released by the U.S. Bureau of Labor Statistics (BLS) Friday, June 5, 2020, unexpectedly rose by 2.5 million in May. While the unexpected growth rate is positive news for the U.S. economy, there are some uncertainties around the data and how job growth will continue to trend throughout the remainder of the year. The May jobs report is a rebound from a very dismal April, so it’s encouraging to see positive numbers, and the stock market reacted positively. However, the surface headlines cover up some facts worth addressing when looking at statistical data.
Jobs Lost and Recovered
As discussed in previous Prevedere economic update reports, as expected the U.S. economy experienced a very sudden downturn followed by a recovery, in line with the shutdown of the economy. The health crisis has necessitated an economic crisis, and, yes, jobs will recover.
We’ve provided some statistics before regarding how many jobs we think will be regained, including citing some economist peers who also believe roughly 40% of jobs may be lost permanently due to the COVID-19 recession. However, 40% of jobs lost means that 60% of jobs recover. And over 80% of those filing for unemployment are filing under temporary status. Therefore, in May, it shouldn’t come as any surprise that there was some leveling off of job losses. Since many were due to mandatory shutdowns, as states moved to reopen it was presumed that temporary job losses would be regained.
So why was the May jobs report such exciting news? Part of it was because economists as a whole, when surveyed, suggested that the report would result in about 8 million jobs lost. When the BLS number came out at 2.5 million jobs gained, it was a big surprise to the positive side.
May employment saw a significant rise in leisure and hospitality, construction, education, health services, and retail trade. These areas have been particularly hard-hit during the pandemic.
Digging Deeper into the Jobs Report
Data has been mostly unreliable since COVID-19. There was already a need for additional high-frequency sources. The nature of this very rapid downturn has caused statistical uncertainty, creating wider deviations between statistical sources than usual.
A few days before the BLS releases their unemployment rate numbers, there is another payroll report from ADP, the private payroll processing company—Total Nonfarm Private Payroll Employment. Year-over-year growth is indicated in green on the following chart.
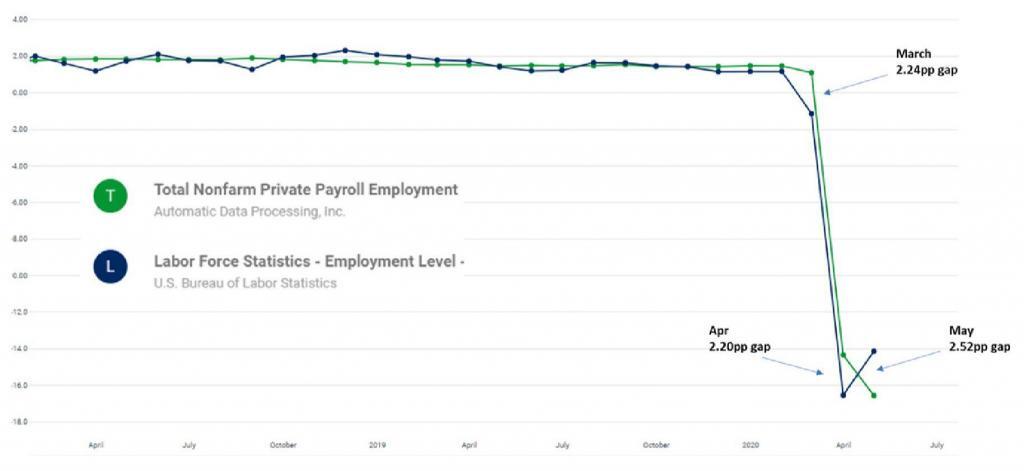
This report tends to be a reliable precursor to what the BLS is going to release just a couple of days later, and the ADP report suggested about 2 million job losses in May.
When looking at both the BLS and ADP numbers on a year-over-year basis, the numbers did align very closely before the crisis. In May, however, the BLS number was much more positive than the green line.
However, the divergence has been par for the course since the coronavirus started. The gaps between what ADP and BLS have been reporting have been generally wide. If you measure it on a difference between the year-over-year change between the two, there is not that much of a difference. May was at a 2.5 percentage point gap between the two. But in the month prior, the ADP number was more positive, and the BLS one was more negative. And very similar in March, there was a two and a quarter percentage point gap between the two.
All of this leads up to potential revisions to the May BLS unemployment number as there is a lot of uncertainty in the data. Many jumped to the conclusion that the recession is over and that jobs are recovering much faster than originally anticipated, but some broader measures of overall economic performance should be accounted for. There is also a need to separate the issue that some jobs are going to recover naturally due to businesses reopening. The crux of the labor issue is how many? Will it be 80-90% of jobs lost or a percentage much smaller, creating more significant problems for the U.S. economy going forward.
It’s encouraging to see positive numbers from the BLS. However, it’s essential to keep in mind that these things oscillate in that even normally very high statistical correlations between surveys are showing much different numbers, as seen in March and April.
Data Misclassification Errors
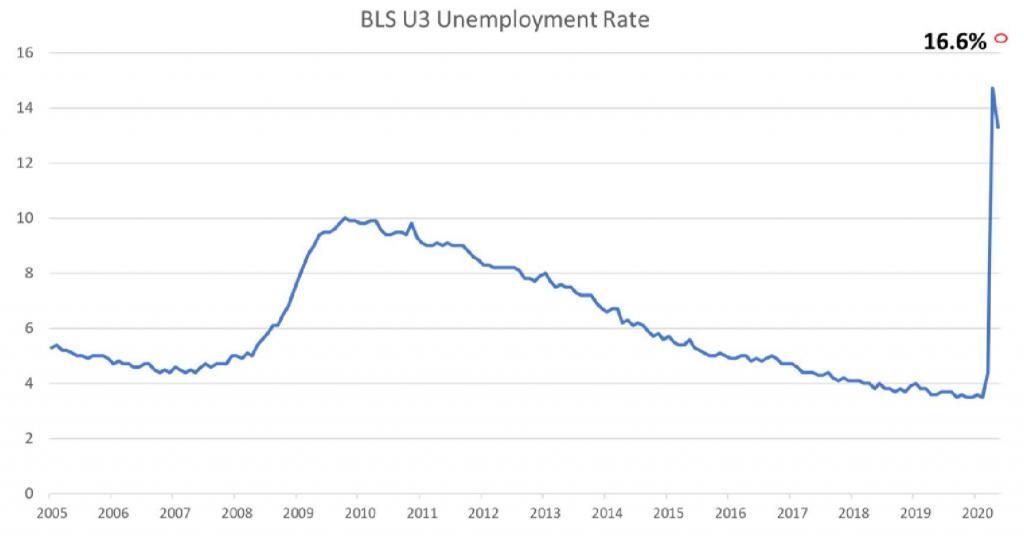
Another caveat to the May unemployment rate of 13.3% is that the BLS is reporting it could possibly be three percentage points higher than the official number due to misclassification errors. These misclassification numbers have to do with the way people are filing unemployment, being employed but absent, versus temporary unemployed, which would make the unemployment rate higher.
Many workers had been mistakenly classified as “employed but absent from work due to ‘other reasons’” who should have been classified as “unemployed on temporary layoff,” the Bureau of Labor Statistics wrote in a note at the bottom of the report. If those workers were classified correctly, their note stated, “the overall unemployment rate would have been about three percentage points higher than reported.” Had these numbers been represented in May, the unemployment rate would be at 16.3%, not 13.3%. It is important to note that the misclassifications also occurred in the April and March reports. The April unemployment rate would have been 19.7% rather than 14.7%. In March, it would have been 5.4% instead of 4.4%.
Challenges in BLS Household Surveys
Historical context is important because whether the U.S. unemployment rate is 16.6% or 13.3% is still higher than at any other time since the Great Recession of 2008-2009.
Also, adding to the uncertainty of the actual unemployment rate is the fact that the BLS is stating that it’s getting more difficult to survey respondents. These statistics come from a household survey that the BLS conducts every month and has been doing for years. They’ve noted that since coronavirus, the survey response rate has dropped significantly. They usually have a survey response rate of around 82%, which has fallen 15 percentage points down to 67%.
The standard statistical approach when this happens is to try to accommodate for error. But whenever there is a significant change in survey response rates, it can be assumed that there will be a wider margin of error, indicative that data may need to be revised further down the road.
A decrease in survey respondents is a sign of the times. Household surveys that normally are a combination of phone calls and other approaches might result in less activity due to social distancing requirements. Conclusion
In the U.S., positive economic numbers such as the May jobs report are a welcome sign, but a long, steep road to recovery remains likely. We do expect the job market to continue to improve, seeing many jobs gained over the next few months as more businesses reopen. However, we do need to maintain additional context to the numbers and understand that there’s still a wide margin of error.
We still have a long way to go in the recovery, and any positive surprise release like we’ve seen last week with the job numbers, has to be taken into consideration with the broader context. And that this doesn’t mean we’re all sudden in line for v-shaped recovery and everything’s going to be okay. We need to prepare ourselves for a realistic return to the January and February pre-pandemic unemployment rates.
It is essential to consider the positive numbers. But let’s also take the broader context of the very challenging economic situation that we’re facing. We will learn a lot in the coming months as the country begins to roll back some of the lockdown provisions, and increasingly workers get back to work.
Economic Scenario Planning in a COVID-19 World
Planning and forecasting based on historical performance is no longer valid in today’s economic climate. As you look ahead beyond the immediate crisis and consider your business plans, having visibility to external economic factors and being able to consider how your company will fare in the “new normal” economy are paramount. This is what we call Intelligent Forecasting.
Prevedere helps companies answer, “what’s next?”, using global data and AI technology.
Whether it is a black swan event like the COVID-19 pandemic, less severe shocks like falling oil prices, or the regular contraction-expansion business cycles, Prevedere provides executives with insights on global forces impacting their business.